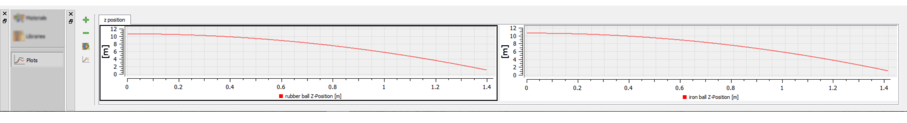
For the purpose of simulation data analysis and post processing, the user can use this graphical technique for representing a simulation data set as a graph, showing the relationship between two or more variables. The visual presentation of different functions is very useful for users who can quickly derive an understanding as a short path to gaining insight in terms of testing assumptions, model selection, relationship identification, factor effect determination, etc. as shown in the following image a Plotting Area of two graphs.
The panel of the Plotting Library is located vertically at its left-side, presenting the following four buttons:
Add New Plot Tab: This button allows the user to add a new plot tab to Plotting Library.
Delete Current Plot Tab: This button allows the user to delete the activated Plot Tab.
Manage Library: The user can add multiple graphs assigned to present the desired simulation data. Four types of chart formation are available, as shown in the following image Single Plot, Dual Vertical Plots, Dual Horizontal Plots, and Four Plots.
Manage Curves: This launches the Manage Curves dialog box (as shown in the following image) letting the user to plot selected channel(s) on the desired graph area.
The Plotting Area is only associated with the Simulation Tab; it appears at the bottom of the Simulation Workbench once the Simulation Tab is activated.