The integrated debugger in the interactive mode makes it easy for Java Script writer to follow the execution of the Java Script, and to check the values of variables, which makes creating new Java scripts faster, and fixing issues in existing ones easier.
Num
Description
1
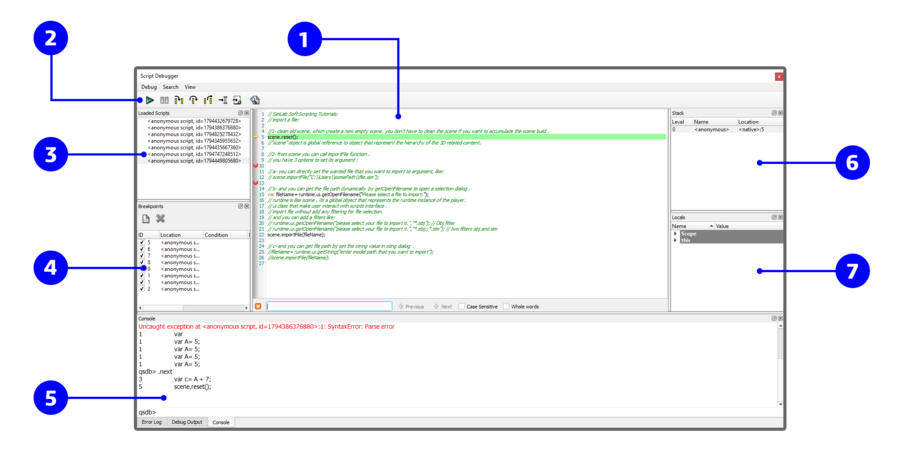
Code Widget: The code widget shows the code of the currently selected script. The widget displays an arrow in the left margin, marking the code line that is being executed. Clicking in the margin of a line will cause a breakpoint to be toggled at that line. A breakpoint has to be set on a line that contains an actual statement in order to be useful. When an uncaught script exception occurs, the offending line will be shown with a red background.
2
Continue: Evaluation will resume normally.
Step Into: Evaluation will resume until the next statement is reached.
Step Over: Evaluation will resume until the next statement is reached; but if the current statement is a function call, the debugger will treat it as a single statement.
Step Out: Evaluation will resume until the current function exits and the next statement is reached.
Run to New Script: Run until the first statement of a new script is reached.
Run to Cursor: Run until the statement at the cursor is reached.
3
Scripts Widget: The scripts widget shows the scripts that are currently loaded in the script engine. Clicking on a script will cause its code to be shown in the code widget. When a script is no longer referenced by the debugger target it is removed from the scripts widget.
4
Breakpoints Widget: The breakpoints widget shows all the breakpoints that are set. A breakpoint can be disabled or enabled by clicking the checkbox next to the breakpoint's ID (the ID is provided so that the breakpoint can be manipulated through the console widget as well).
5
Console Widget: The console widget provides a command-line interface to the debugger's functionality, and also serves as an interactive script interpreter. The set of commands and their syntax is inspired by GDB, the GNU Debugger. Commands and script variables are auto-completed through the TAB key.
Debug Output Widget: The debug output widget shows messages generated by the print() script function. Scripts can use the special variables __FILE__ and __LINE__ to include the current location information in the messages.
Error Log Widget: The error log widget shows error messages that have been generated. All uncaught exceptions that occur in the engine will appear here.
6
Stack Widget: The stack widget shows a backtrace of the script execution state. Each row represents one frame in the stack. A row contains the frame index (0 being the inner-most frame), the name of the script function, and the location (file name and line number). To select a particular stack frame to inspect, click on its row.
7
Locals Widget: The locals widget shows the variables that are local to the currently selected stack frame; that is, the properties of the objects in the scope chain and the this-object. Objects can be expanded, so that their properties can be examined, recursively. Properties whose value has changed are shown in bold font.